The purpose of this page is to explain the indicator about valuation in stock market among the indicators used in the analysis of companies and stocks.
Market capitalization is the total value of common stock issued by a company.
It is often called the Market Cap.
Simply put, market capitalization is an indicator that represents the presence of the stock in the stock market.
Market capitalization can be calculated by multiplying the stock price by the total number of issued shares.
Market Capitalization = Stock price × Total number of issued shares
Market capitalization can be calculated by the above formula, but what determines market capitalization?
It is understandable that market capitalization increases as stock prices rise.
But may the market capitalization increase if the number of issued shares increases?
First, market capitalization is discussed in terms of profits.
Stock prices can be expressed as the product of earnings per share (EPS) and its multiple (PER).
EPS is net income divided by total number of issued shares.
Stock price = EPS × PER
EPS =
Net Income
Total number of issued shares
Rewriting the market capitalization formula using this formula leads to the following formula:
Market Capitalization = = Net Income × PER
This formula shows that market capitalization is affected by net income, but not by the number of shares outstanding.
Also, from a profit perspective, market capitalization can be viewed as a reflection of net profit and expectations for the future.
In other words, market capitalization is the size of common stocks in the stock market, and the company's net profit and expectations for the future are considered to be the factors that shape that size.
Dividing both sides of this formula by the total number of issued shares returns the original formula about stock price.
Share price = EPS × PER
That is, if the number of issued shares is the same, the market capitalization and stock price are in a proportional relationship.
However, stock prices correspond to earnings per share, and are affected by changes in the number of issued shares.
For example, if a stock split doubles the number of outstanding shares, the theoretical stock price is halved.
However, even if it is the share price were halved, the number of shares would increase, so the total value of shares owned by the shareholders would not change before and after the split.
Also, the market capitalization, which is the total value of the shares owned by these common shareholders, will not change before or after the split.
In this way, even if the stock price of the same company, the stock price level changes depending on the total number of issued shares.
In addition, the stock price level at the time of listing also differs from company to company.
Therefore, the stock price is inappropriate as an indicator of the presence in the stock market.
On the other hand, market capitalization does not change with the number of outstanding shares.
In additon, the market capitalization reflects the profit of the company.
Therefore, when considering the presence of stocks of different companies in the market, market capitalization is more appropriate than stock prices.
That said, the path of stock prices on a stock chart usually follows the same shape as the path of market capitalization.
Market capitalization charts are not common, so investors see market capitalization changes through stock price changes.
Even though the stock price is affected by the number of outstanding shares, the trend of the stock price and the market capitalization have the same shape because the stock price chart is corrected as necessary.
For example, in the case of a stock split, even if the stock price falls as a result, the stock price before the split is corrected by the new number of shares.
In the stock market, companies are classified as Large Cap, Mid Cap, and Small Cap, depending on the size of their market capitalization.
Large Cap stocks are stocks with large net income and/or a large number of issued shares.
On the other hand, small Cap stocks are stocks with small net income and/or a small number of issued shares.
So far, we have been discussing the market capitalization as having no effect on the number of issued shares, but that was from the perspective of profit.
However, in reality, the number of issued shares can affect the market capitalization.
Stocks with high liquidity tend to be priced more easily in the market, and share prices tend to be stable.
On the other hand, for stocks with low liquidity, the order prices in the market tend to be discrete, which makes it difficult for trading to occur and stock prices to fluctuate easily.
Therefore, from the perspective of liquidity risk, stocks with a large number of outstanding shares tend to be preferred over stocks with a small number of shares.
In particular, institutional investors handle large amounts of money, so they rarely handle shares with low liquidity.
In addition, stocks with large market capitalization are more likely to be included in ETFs and mutual funds.
Therefore, even if the stock is not selected by investors, the stock price can be supported through the purchase of ETFs and mutual funds.
But liquidity risk is not the risk that matters to sole owners of companies.
In addition, the unintentional support of stocks with large market capitalization can be a factor that hinders the formation of fair value by the market.
From a different point of view, small cap stocks do not attract the attention of the market, so they often do not form appropriate stock prices relative to profits, and their stock prices tend to fluctuate.
As such, small cap stocks can perform much better than large cap stocks when prices rise.
Therefore, for individual investors, acquiring both large cap issues and small cap stocks can be an option for diversified investment.
By the way, acquiring all shares in a company means becoming the sole owner of that company.
For this reason, market capitalization, which is the price of all shares, tends to be thought of as a cost equivalent to the purchase price of a company.
However, market capitalization is the total value of common stock and is a valuation of equity capital in the balance sheet.
When acquiring a company, the entire balance sheet is purchased, so it is necessary to pay an additional amount considering the evaluation value other than the equity capital.
In other words, market capitalization is the minimum amount required to buy a company.
Enterprise value (EV) is the discounted present value of cash flows generated from the business in the future.
In the following, along with the explanation of EV, corporate value (CV) which is similer concept to EV is also introduced.
In the market capitalization section, it is mentioned that when acquiring a company, additional amount is necessary on the market capitalization.
Corporate value is the value that interest-bearing debt is added to the market capitalization as the additonal amount.
CV = Market Capitalization + Interest-bearing debt
Interest-bearing debt is debt that requires interest payments, regardless of whether it is short-term or long-term.
For the sake of simplicity, this website uses only interest-bearing debt as as the additional amount on market capitalization.
However, to be precise, there are cases where additional amounts are required in addition to interest-bearing debt.
For example, they are addition amount to non-common equity holders, such as preferred stock or non-controlling interests.
Such non-common stockholders should be paid an amount corresponding to their value.
The meaning of CV is as follows.
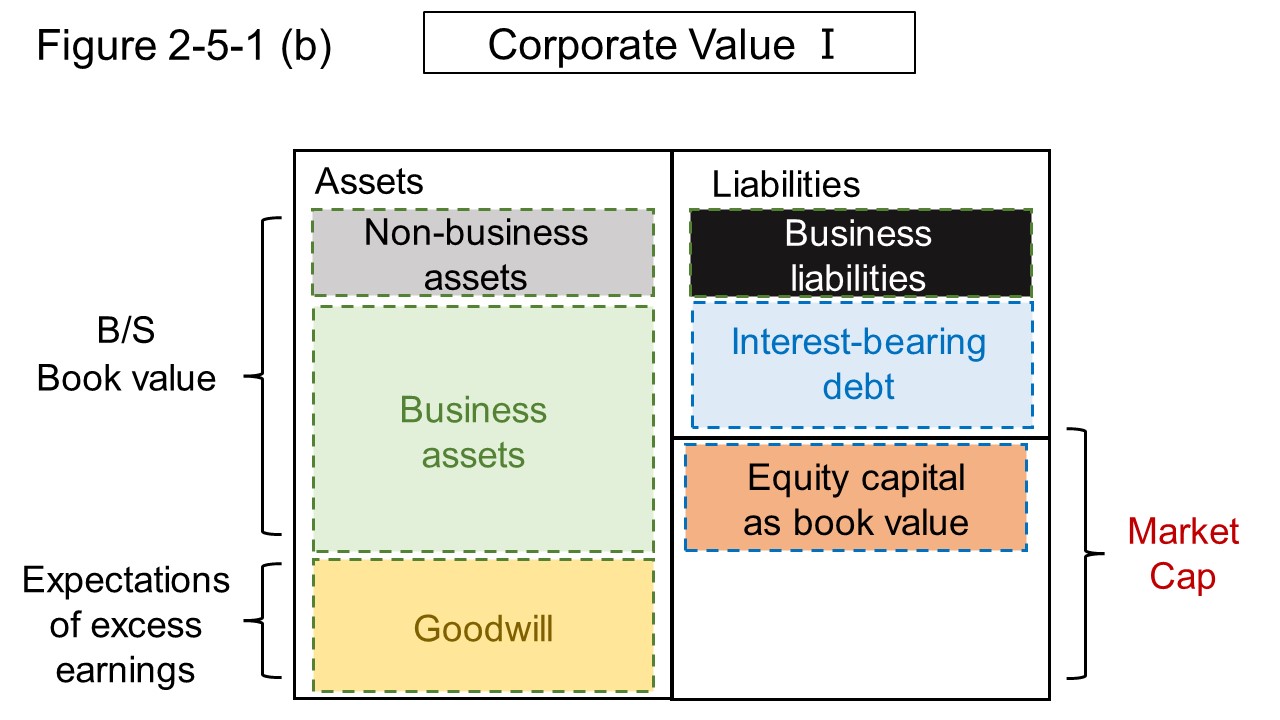
The balance sheet as book value can be divided into business assets and non-business assets on the left side, and business liabilities, interest-bearing debt, and net assets on the right side.
Business assets are current assets such as notes and accounts receivable-trade, merchandise and finished goods, and tangible and intangible fixed assets related to the business.
Non-business assets are assets that are easy to sell, such as trading securities and idle land, which are not directly related to business CF, in addition to cash and deposits.
Business liabilities are liabilities arising in the course of business-related operations, such as notes and accounts payable-trade, provision for bonuses.
After classifying assets and liabilities in this way, if equity capital in net assets is replaced with market capitalization, the increase from the book value of assets can be considered as goodwill as shown in Figure 2-5-1 (b).

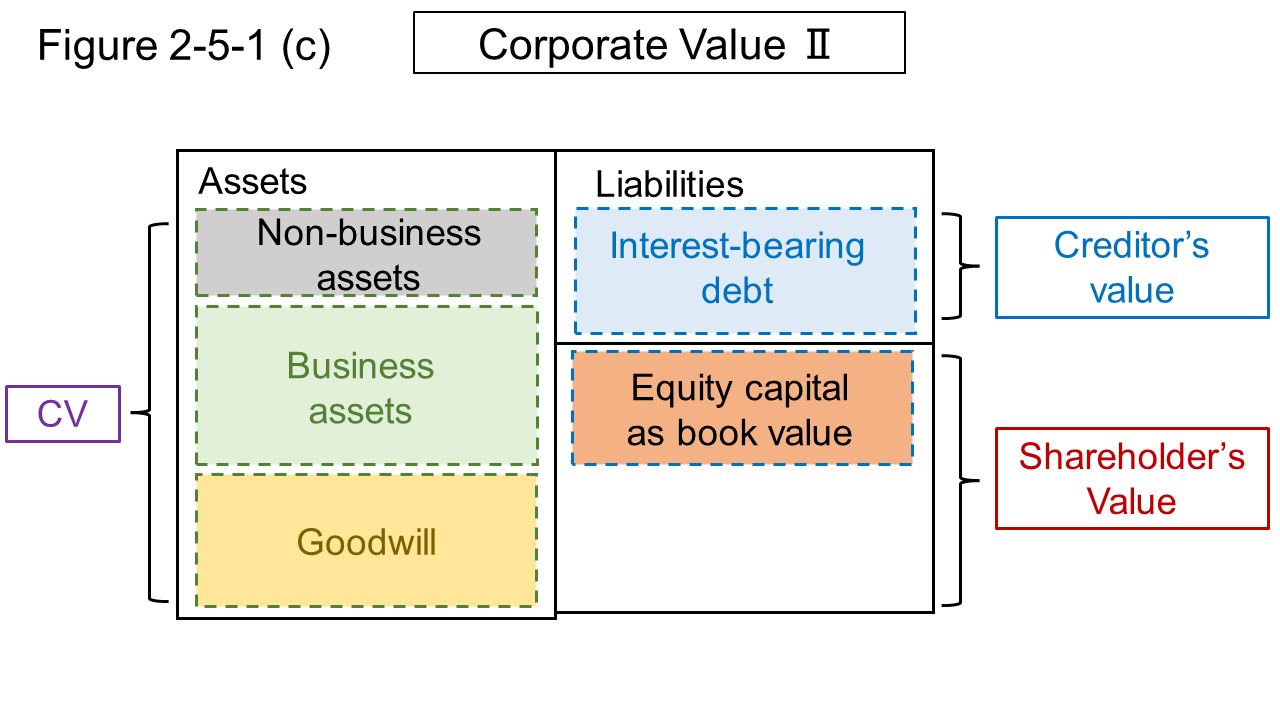
Next, as shown in Figure 2-5-1 (c), if business liabilities are offset by current assets of business assets, fixed assets will mainly remain on the left side of the balance sheet as business assets.
At this time, the right side of the balance sheet is market capitalization and interest-bearing debt, which matches the right side of the CV formula.

CV is the value, which is shown on the left side of Figure 2-5-1 (c), that goodwill is added to business assets and non-business assets.
And, the part of the interest-bearing debt on the right side is the value for creditors (creditor's value), and the part obtained by subtracting the creditor value from the corporate value is the value for shareholders (shareholder's value).
In short, CV is a value that belongs to both creditors and shareholders, which corresponds to the purchase price of the company.
By the way, isn't what an acquirer wants not a company but a business?
If purchasing the business, acquirer don't need non-business assets that are not related to business on the left side of Figure 2-5-1 (c).
Business value is CV minus this non-business asset.
Enterprise value (EV) is the value that this non-business asset is excluded from CV.
Enterprise value is expressed by the following formula.
EV = Market Capitalization + Interest-bearing debt − Non-business assets = Market Capitalization + Net interest-bearing debt
Net interest-bearing debt is the difference between interest-bearing debt and non-business assets.
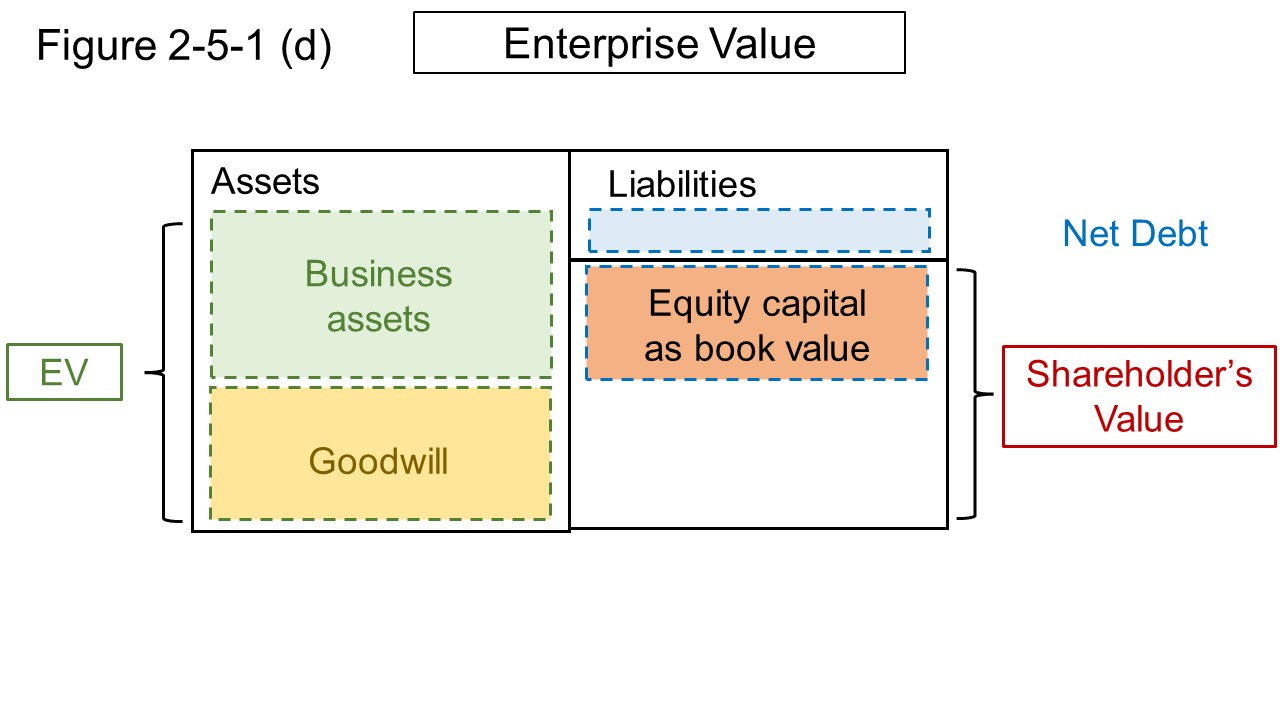
By offsetting part of interest-bearing debt with non-business assets from Figure 2-5-1 (c), Figure 2-5-1 (d) is obtained.
Offsetting these is correspond to repaying part of the interest-bearing debt with non-business assets after the acquisition.
Market capitalization and net interest-bearing debt remain on the right side of Figure 2-5-1 (d), which matches the EV formula.
If a company is aquired by the amount of CV and part of the interest-bearing debt is paied off with non-business assets, EV remains.
In short, EV is equivalent to the net amount of a business acquisition.
And on the right side of Figure 2-5-1 (d), market capitalization and net interest-bearing debt remain, which is consistent with the EV formula.
In other words, if a company is acquired for the amount of CV and a part of its interest-bearing debt is repaid on non-business assets, the EV remains.
In short, EV is equivalent to the net amount of a business acquisition.

EV,shown on the left side of Figure 2-5-1 (d), is an value of the ability of a business to generate cash, taking into account business assets and goodwill.
In other words, as mentioned at the beginning, EV corresponds to the discounted present value of future cash flows generated from the business in the future.
The explanation so far is in line with the method, which is called market approach, that evaluate enterprise value based on market capitalization as shareholder value.
There are several other methods for evaluating enterprise value, one of which is called the income approach.
In the income approach, the enterprise value is calculated by the DCF method as the discounted present value of the FCF that the business will generate in the future.
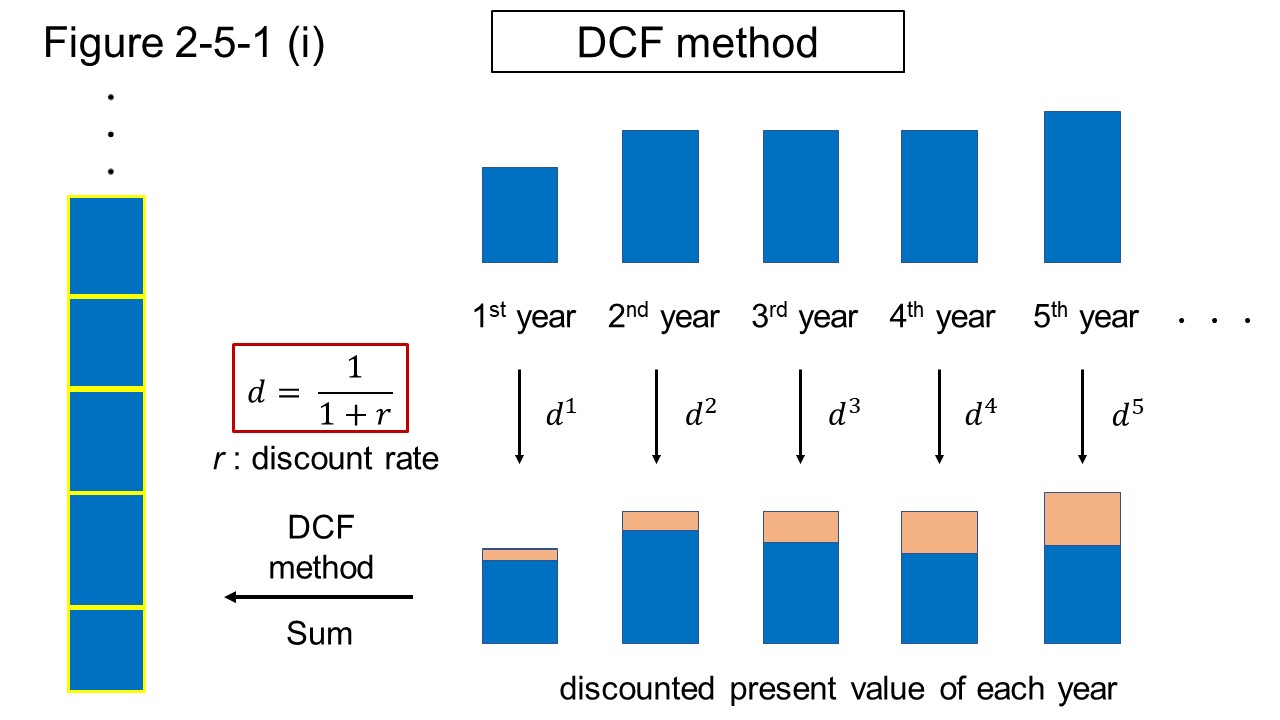
Discounted Cash Flow method (DCF method) is a way of calculating the discounted present value of cash flows generated in the future by the invested company or stock.
The discounted present value can be obtained by discounting future cash flows to the present.
In the DCF method, the discounted present value for the cash flows to be generated in the future is calculated by discounting the cash flows of each year to the present value and summing them up, as shown in Figure 2-5-1 (i).
By the way, the cash flow here does not have to be the CF of the company, it can be anything that is a flow of money, such as interest, dividends, FCF, etc. of the company.
When FCF is used for cash flow, the solution obtained by the DCF method means the enterprise value (EV).

The DCF method requires a discounted target and a discount rate.
Here, the formula used in the DCF method is derived by using \(T\) as the discounted target and \(r\) as the discount rate.
but it is only under \(0 \lt\ r\) conditions.
(i) Assuming that discounted target \(T\) (FCF or dividend) to be discounted is constant for \(n\) years, total discounted present value \(S_{n}\) generated in the future is expressed by equation (4-1).
By multiplying both sides of the equation (4-1) by \((1 + r)\), the equation (4-2) is obtained.
Then, subtracting equation (4-1) from equation (4-2) gives the following formula (4-A).
This formula (4-A) is referred to here as n-year zero growth model.
In the formula (4-A), when \(n\ \to\ \infty\), the second term on the right side converges to zero, so the equation is as formula (4-B).
This formula (4-B) is referred to here as permanent zero growth model.
(ii) Assuming that the discounted target \(T\) is constant for n years from the (k + 1)st year, total discounted present value \(S_{k+1 ~ \infty}\) generated in the future is given by subtracting equation (4-A) with n = k from equation (4-B).
This equation (4-C) is referred to here as decelerated permanent zero growth model.
(iii) If the discounted target \(T\) grows by \(g\) % each year, total discounted present value \(S_{n}\) of cash flow which is generated by year \(n\) is expressed by equation (4-3).
Multiplying both sides of the equation (4-3) by \((1+r)/(1+g)\), the formula (4-4) is obtained.
Then, subtracting equation (4-3) from equation (4-4) gives the following formula.
This formula (D) is referred to here as n-year g-growth model.
In formula (4-D), if \(r \lt\ g\), \( (1 + g)T/(r - g) \ \lt\ 0 \).
And, when \(n\ \to\ \infty\), \( (1 + g)^n / (1 + r)^n \to\ \infty \).
Therefore, if \(r \lt\ g\), total discounted present value \(S_{n}\) of cash flow, which is generated in the future, diverges to \(+\infty\).
On the other hand, if \(g \lt\ r\), when \(n\ \to\ \infty\),
\(
(1 + g)^n / (1 + r)^n
\to\ 0
\) .
Therefore, \(S_{n}\) converges to the following formula (4-E).
This formula (4-E) is referred to here as permanent growth model.
By the way, when \(g = 0\), the equation (4-D) is the same as the equation (4-A) and the equation (4-E) is the same as the equation (4-B).
Here, some example of calculating the enterprise value (EV) using the DCF method will be shown.
FCF for each year is used for the discounted target \(T\), and WACC is used for the discount rate \(r\).
It is assumeed the company with an FCF of 3.0 billion yen and shareholders' equity of market value : interest-bearing debt = 2 : 1.
If the cost of equity is 8%, the cost of debt is 0%, and the effective tax rate is 30%, the WACC of the company is 5.3%.
The outline of the DCF method will be explained below using this company.
Assuming that the company has no prospect of growth, but the FCF is stable and will be forever, the formula (4-B) of the permanent zero growth model is used.
That is, the EV of this company is calculated to be 56.6 billion yen.
Consider the case where the FCF of the company continues to grow at 10% for 10 years and then becomes a stable company.
In this case, formula (4-D) of the n-year g-growth model is used for the first 10 years, and formula (4-C) of the decelerated permanent zero growth model is used thereafter.
(i) First 10 years
Therefore, the total discounted present value of FCF expected in the first 10 years is 38.4 billion yen.
(ii) After the 11th year
Since there is no growth from the 11th year, first find the free cash flow \(FCF_{10}\) in the 10th year.
Then, apply this \(FCF_{10}\) to \(T\) in formula (4-C).
Therefore, the expected total discounted present value of FCF after the 11th year is 87.6 billion yen.
(iii) Total
The EV of this company is calculated as 126.2 billion yen by summing the total discounted present values from the 1st to 10th years and from the 11th year onwards.